Sample Response
IELTS Band 9 Sample 7 - Task 1 - Graph

Question #6
The bar graph below gives information on the number of children and older people as a percentage of the population in two different years, 1971 and 2002. Summarise the information by selecting and reporting the main features, and make comparisons where relevant.
Write at least 150 words
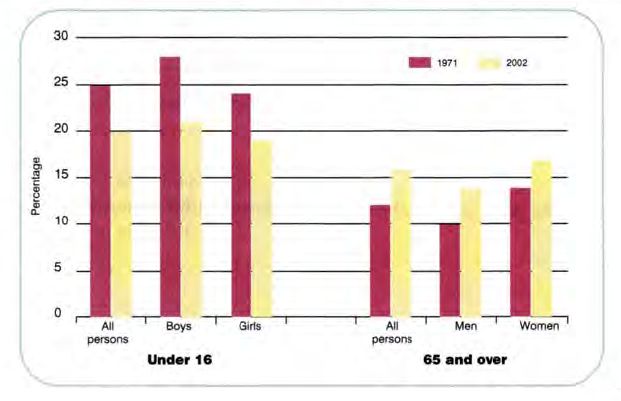
The graphs show the numbers of under 16s and over 65s in the UK as a percentage of the total population in both 1971 and 2002. The graph also shows the number of males and females in each group.
Between 1971 and 2002 the number of under16s fell as a percentage of the total population from 25% to 20%. The percentage drop was similar for both boys and girls. In 2002, there were still roughly 5 boys for every 4 girls in this population group.
At the same time, the percentage of over 65s as a percentage of the total population rose from around 12% in 1971 to approximately 16% in 2002, with the number of men in this category perhaps rising slightly more significantly. However, the percentage of women in the age group still remained higher than
that of men in 2002.
Overall, the graph shows the trend towards an ageing UK population with the percentage of under 16s falling by 5% and the percentage of over 65s rising by about 4% in this 30 year period. The difference in numbers between males and females closed slightly in both age groups during this time but not dramatically.

.png)


